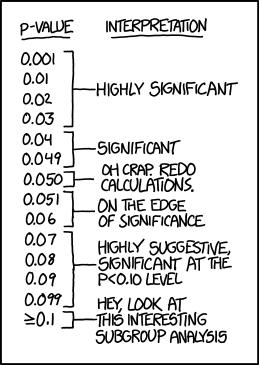
Big thanks to Eva Murray and Andy Kriebel for inviting me onto their BrightTalk channel for a second time. If you missed it, Stats for Data Visualization Part 2 served up a refresher on p-values:

Since our primary audience tends to be those in data visualization, I used the regression output in Tableau to highlight the p-value in a test for regression towards the end. However, I spent the majority of the webinar discussing p-values in general because the logic of p-values applies broadly to all those tests you may or may not remember from school: t-tests, Chi-Square, z-tests, f-tests, Pearson, Spearman, ANOVA, MANOVA, MANCOVA, etc etc.
I’m dedicating the remainder of this post to some “rules” about statistical tests. If you consider publishing your research, you’ll be required to give more information about your data for researchers to consider your p-value meaningful. In the webinar, I did not dive into the assumptions and conditions necessary for a test for linear regression and it would be careless of me to leave it out of my blog. If you use p-values to drive decisions, please read on.
More about Tests for Linear Regression
Cautions always come with statistical tests – those cautions do not fall solely on the p-value “cut-off” debate.

Do you plan to publish your findings?
To publish your findings in a journal or use your research in a dissertation, the data must meet each condition/assumption before moving forward with the calculations and p-value interpretation, else the p-value is not meaningful.
Each statistical test comes with its own set of conditions and assumptions that justify the use of that test. Tests for Linear Regression have between 5 and 10 assumptions and conditions that must be met (depending on the type of regression and application).
Below I’ve listed a non-exhaustive list of common assumptions/conditions to check before running a test for linear regression (in no particular order).
- The independent and dependent variables are continuous variables.
- The two variables exhibit a linear relationship – check with scatterplot.
- No significant outliers present in the residual plot (AKA points with extremely large residuals) – check with residual plot.
- Observations are independent of each other (as in, the existence of one data point does not influence another) – test with Durbin-Watson statistic.
- The data shows homoscedasticity (which means the variances remains the same along entire line of best fit) – check the residual plot, then test with Levene’s or Brown-Forsythe’s tests.
- Normality – residuals must be approximately normally distributed – check using a histogram, normal probability plot of residuals. (In addition, a dissertation chair may require a Kolmogorov-Smirnov or Shapiro-Wilk test on the dependent and independent variables separately.) As sample size increases, this assumption may not be necessary thanks to the Central Limit Theorem.
- There is no correlation between the independent variable(s) and the residuals – check using a correlation matrix or variance inflation factor (VIF).

Note: Check with your publication and/or dissertation chair for complete list of assumptions and conditions for your specific situation.
Can I use p-values only as a sniff test?
Short answer: Yes. But I recommend learning how to interpret them and their limitations. Glancing over the list of assumptions above can give a good indication of how sensitive regression models are to outliers and outside variables. I’d also be hesitant to draw conclusions based on a p-value alone for small datasets.
I highly recommend looking at the residual plot (from webinar 1) to determine if your linear model is a good overall fit, keeping in mind the assumptions above. Here is a guide to creating a residual plot using Tableau.


its fantastic as your other posts : D, regards for posting.