How Laser Tag Helped Students Learn About Data

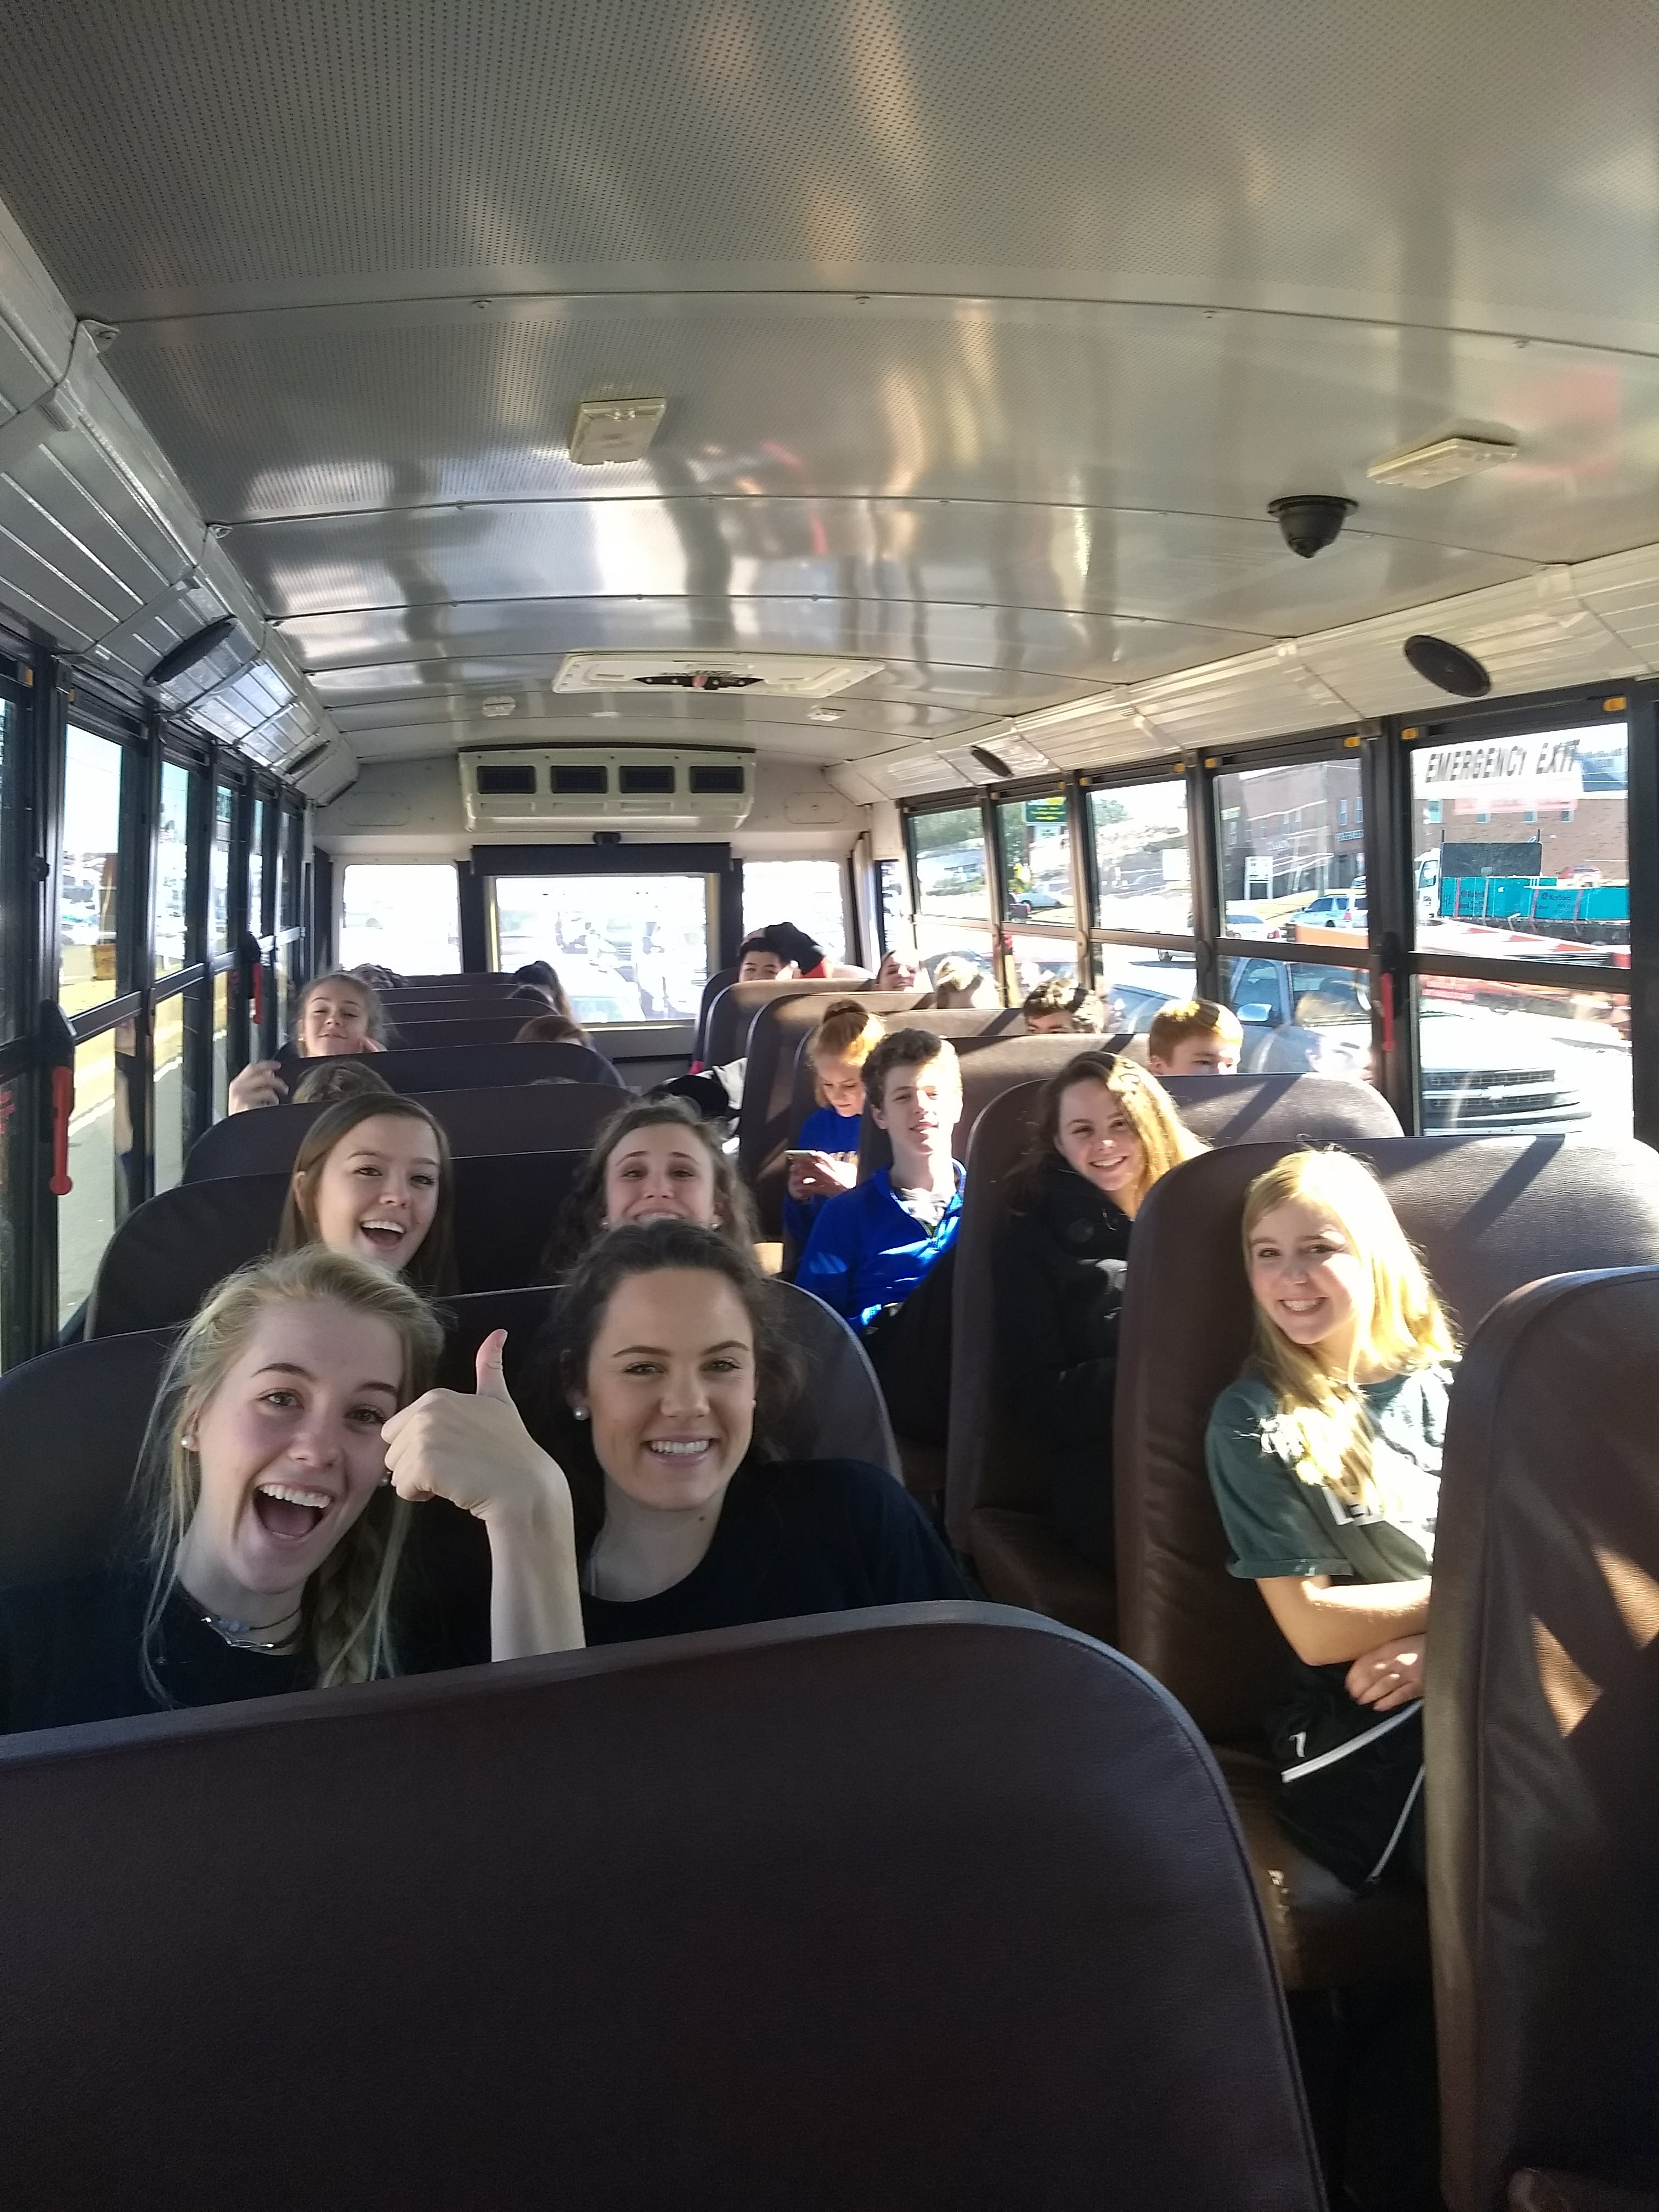
How do you get a group of 15 to 18-year-old students interested in data prep and analysis? Why, you take them to play laser tag, of course!

That’s right, on a cold January day I loaded up two buses of teens and piloted them to an adventure at our local Stars and Strikes. And this is no small feat — this particular trip developed out of months of planning, and after years proclaiming that I will never ever ever ever EVER coordinate my own field trip for high school kids. I mean, you should SEE the stack of paperwork. And the level of responsibility itself made me anxious.

I’m a parent so I get it. And from a teacher’s point of view, many field trips aren’t worth the hassle.

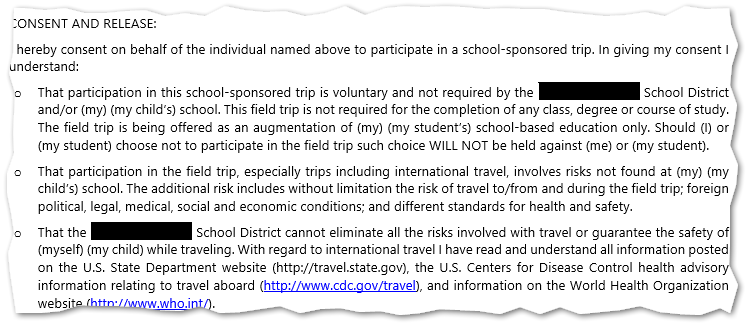
So there I was, field trip money in one hand, clipboard in another: Imagine a caffeinated Tracy Flick. But thanks to the help of two parent chaperones and the AP Psychology teacher (Coach B), we ran the smoothest data-related field trip modern education has ever known.

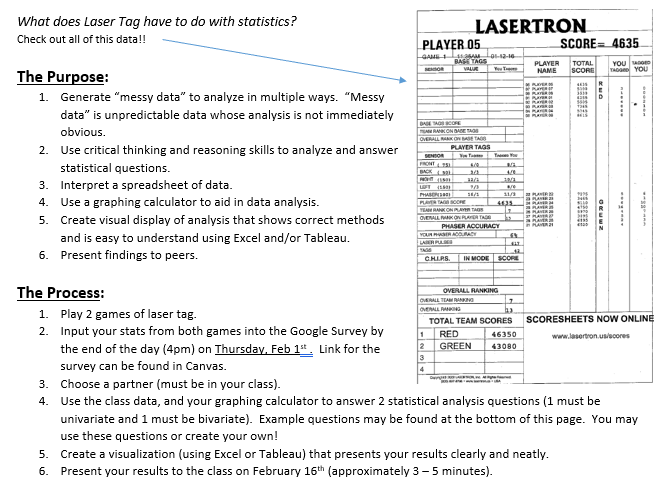
What Does Laser Tag Have to do With Statistics?

Statistics textbooks are full of canned examples and squeaky clean data that often have no bearing on a students’ interests. For example, there is an oh-so-relatable exercise computing standard error for D-glucose contained in a sample of cockroach hindguts. In my experience I’ve learned when students can connect to the data, they are able to connect to the concept. We’re all like that, actually — to produce/collect our own data enables us to see what we otherwise would have missed.

(I can assure you confidence intervals constructed from D-glucose in coachroach hindguts did little for understanding standard error.)

The real world is made up of messy data. It’s full of unknowns, clerical errors, bias, unnecessary columns, confusing date formats, missing values; the list goes on. Laser Tag was suggested to me as a way to collect a “large” amount of data in a relatively short amount of time. And because of the size of the dataset, it required the student to input their own data — creating their own version of messy data complete with clerical errors. From there they’d have to make sense of the data, look for patterns, form hypotheses.

The Project

  • Students entered their data into a Google doc — you can find the complete data here.
  • Each partner team developed two questions for the data: One involving 1-variable analysis, another requiring bivariate analysis.
  • The duos then had to explore, clean, and analyze all 47 rows and 48 columns. At this point in the school year, students had been exposed to data up to about 50 rows, but never had they experienced “wide” data.
  • Analyses and presentations required a visualization, either using Excel or Tableau.

Partner projects lend to fantastic analyses, with half the grading

Playing the Games

Methodology: Each student was randomly assigned to a team using a random number generator. Teams of 5 played each other twice during the field trip. The teams were paired to play each other randomly. If, by chance, a team was chosen to play the same team twice, that choice would be ignored and another random selection would be made until a new team was chosen.

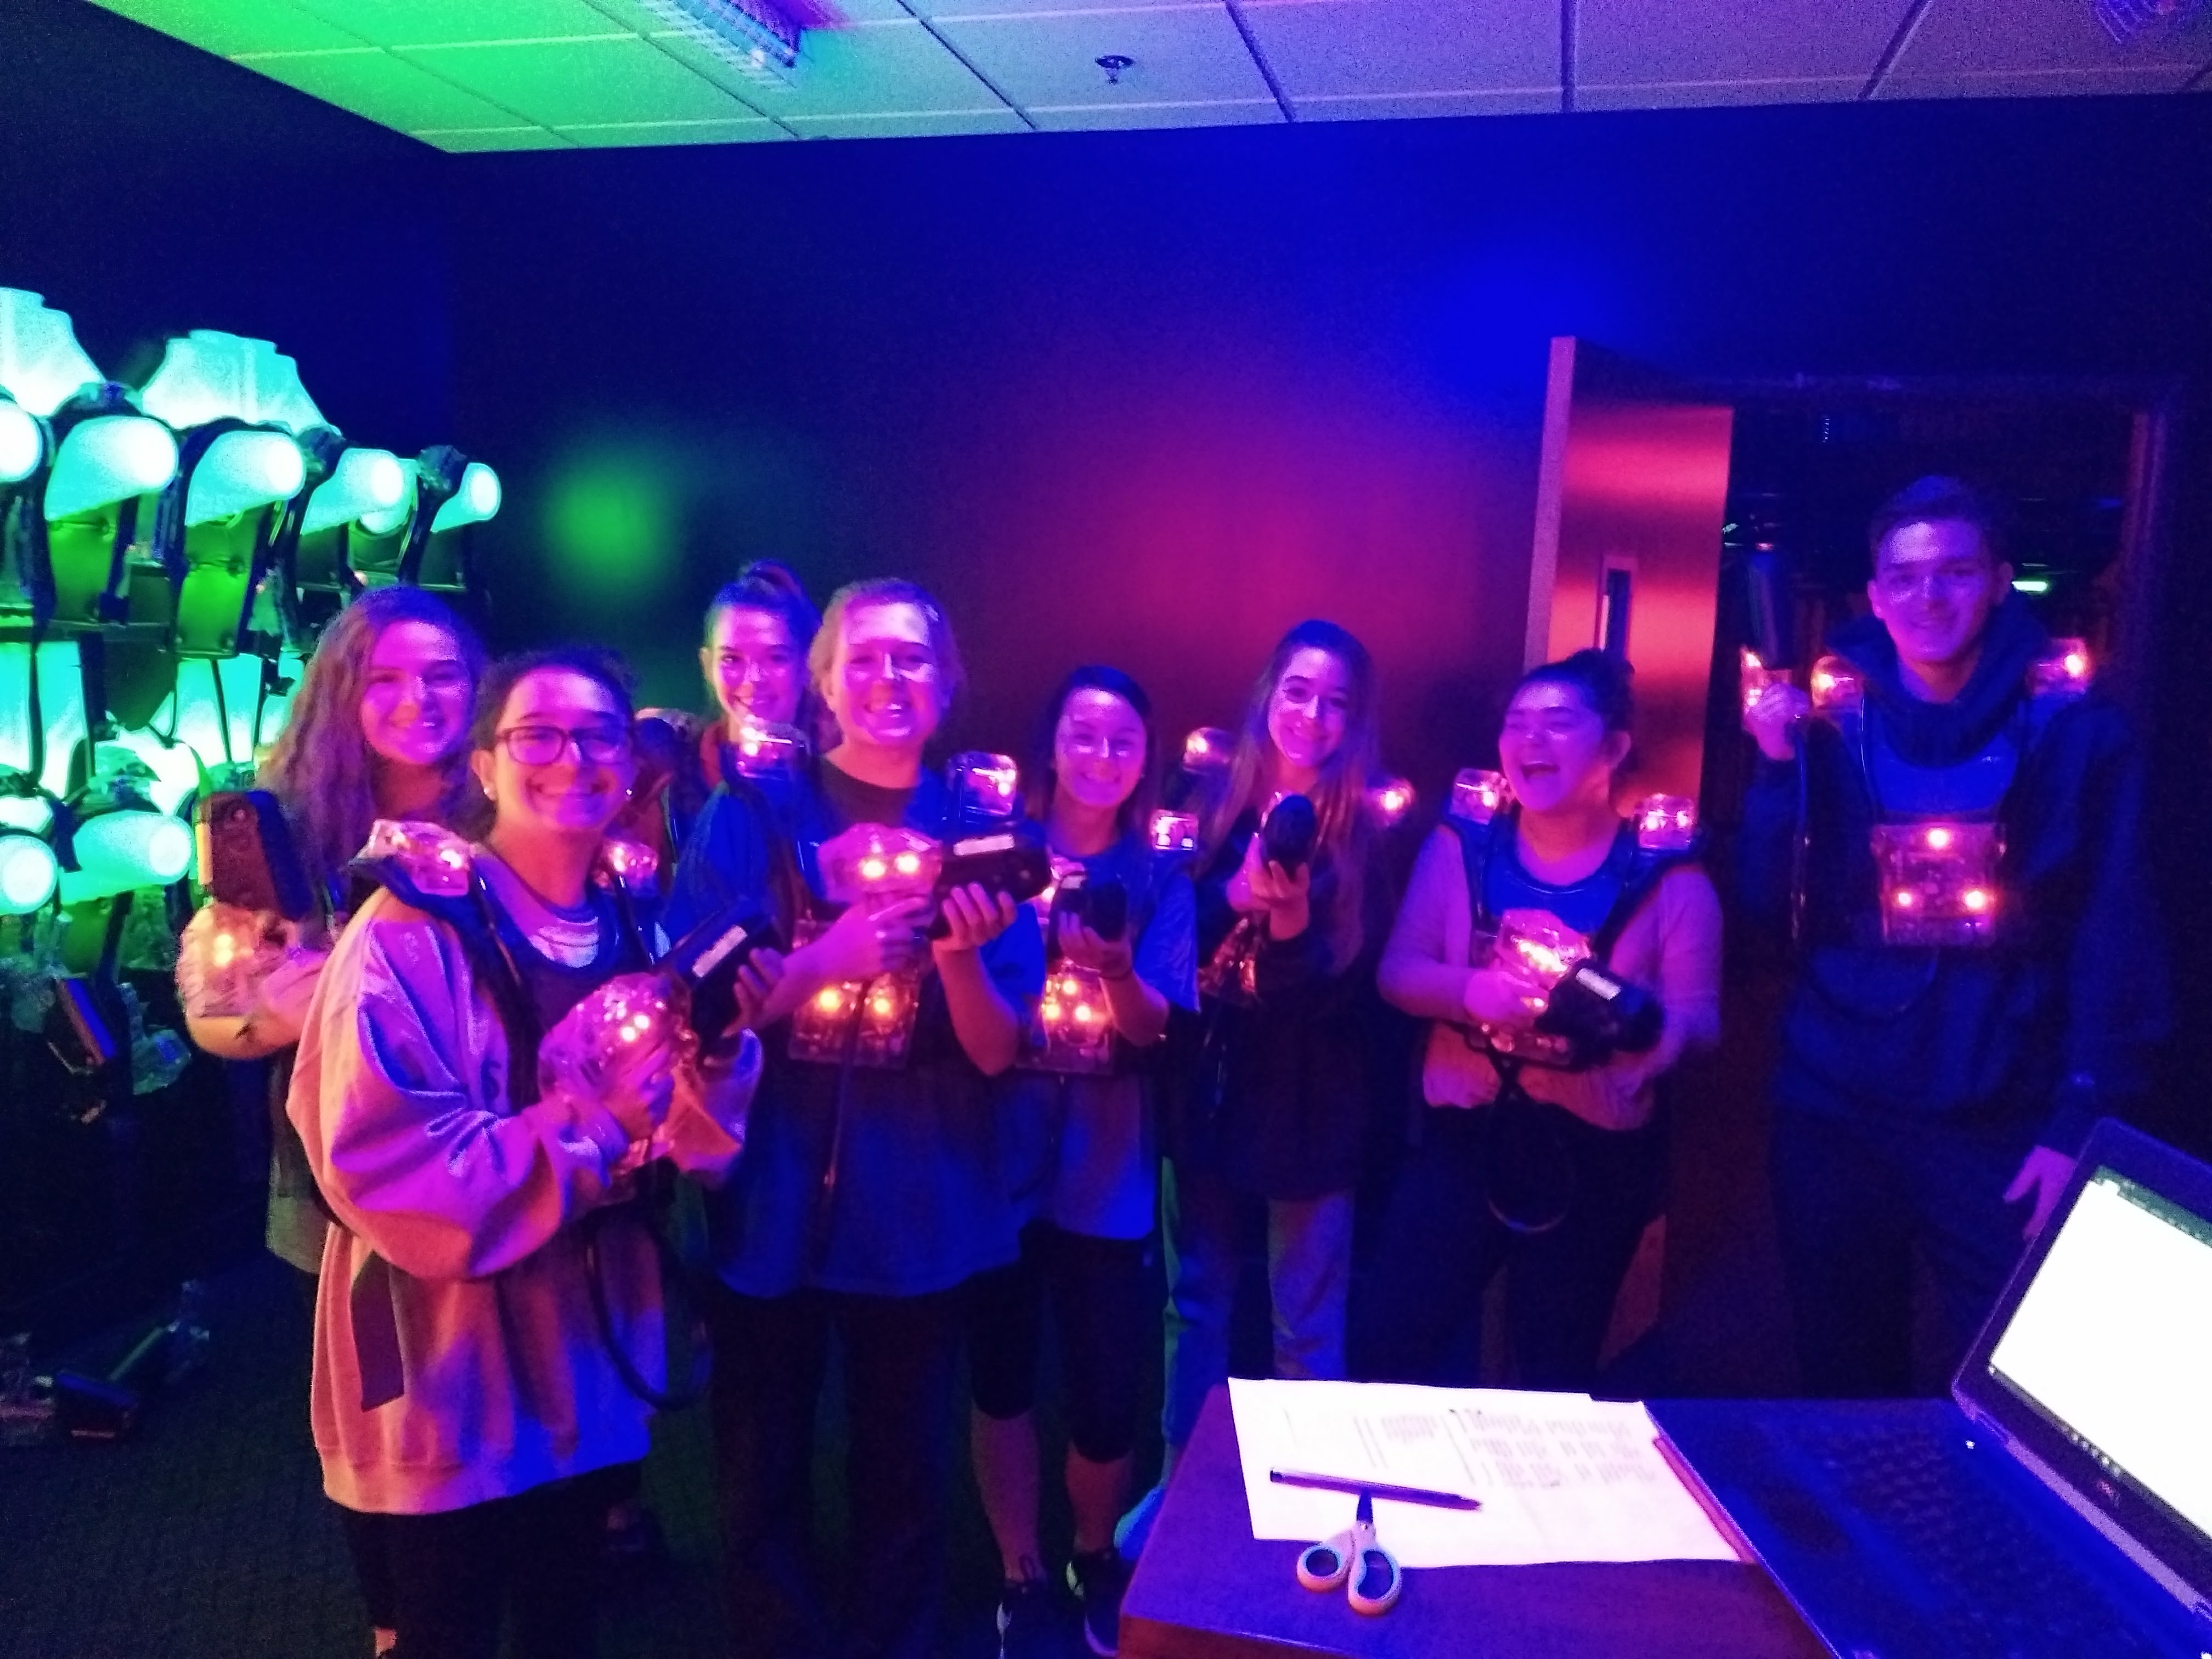
Before each game, I recorded which student wore which laser tag vest number. From the set-up room (see above picture), I could view which vest numbers were leading the fight and which team had the lead. It was entertaining. As the students (and Coach B — we needed one more player for even teams) finished their games, score cards were printed and I handed each student their own personal results. The words, “DON’T lose this” exited my lips often.

Upon our return to school (this only took a few hours, to the students’ dismay), results were already pouring the into the Google doc I’d set up ahead of time.

Teaching Tableau and Excel Skills

The AP Statistics exam is held every year in May, hosted by The College Board. On the exam, students are expected to use a graphing calculator but have no access to a computer or Google. Exactly the opposite of the real world.

Throughout the course, I taught all analysis first by hand, or using the TI-83/84. As students became proficient, I added time in the computer lab to teach basic skills using Excel and Tableau (assignments aligned to the curriculum while teaching skills in data analysis). It was my goal for students to have a general understanding of how to use these “real world” analytics tools while learning and applying AP Statistics curriculum.

After the field trip, we spent three days in the computer lab – ample time to work in Tableau and Excel with teacher guidance. Students spent time exploring the 48-column field trip dataset with both Excel and Tableau. They didn’t realize it, but by deciding which chart type to use for different variables, they were actually reviewing content from earlier in the year.

When plotting bivariate quantitative data, a scatterplot is often the go-to chart

Most faculty members had never heard of Tableau. At lunch one day I sat down with Coach B to demonstrate Tableau’s interface with our field trip dataset.

“What question would you ask this set of data?” I asked.

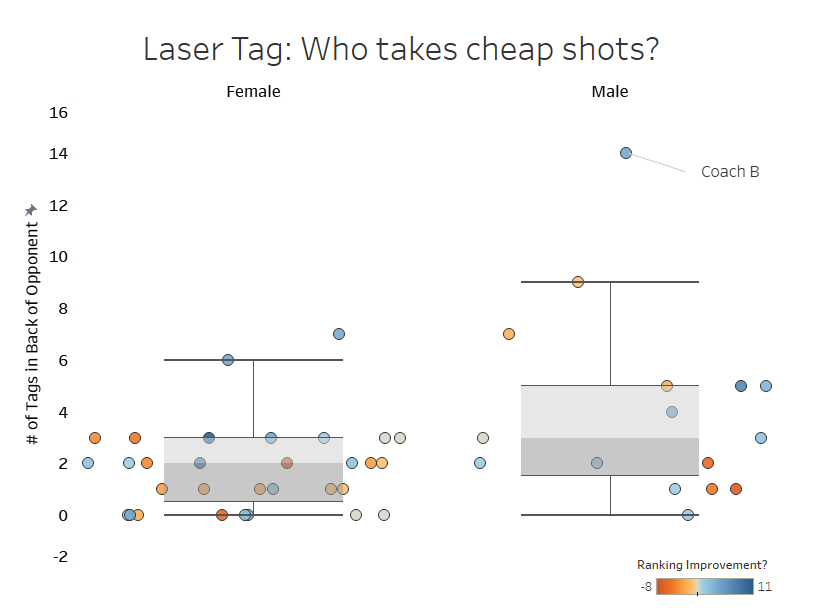
“A back shot is a cheap shot. I wonder who is more likely to take a cheap shot, males or females?”

So I proceeded to pull up a comparison and used box-and-whiskers plots to look for outliers. Within seconds, a large outlier was staring back at us within the pool of male students:

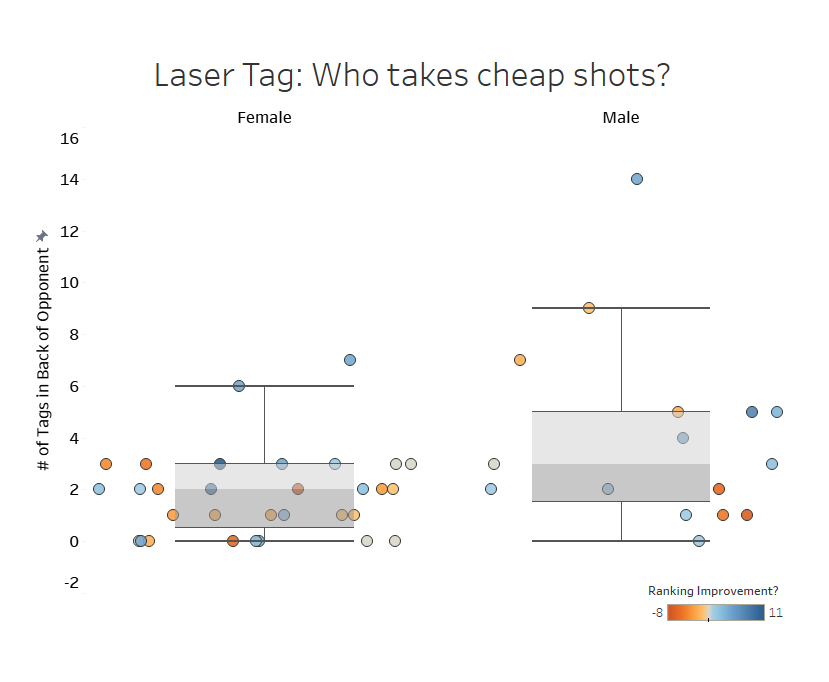
“Ha. I wonder who that was.” – Coach B

“That’s YOU.” – Me

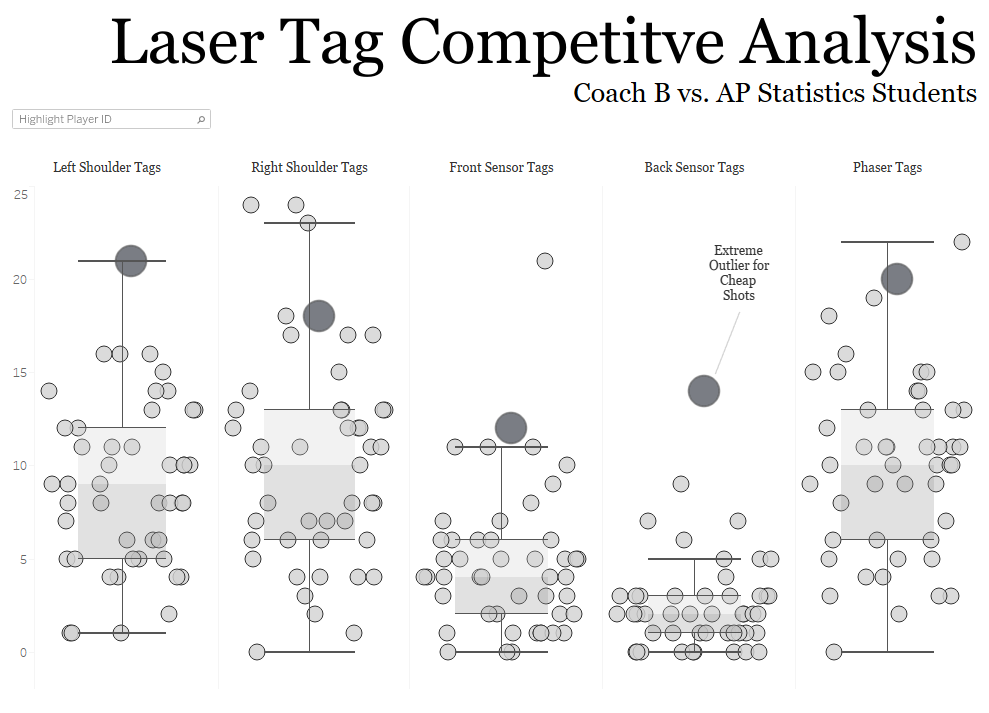
From there, I created a tongue-in-cheek competitive analysis from the data:

Full color version found here.

Student Response

I’ve been teaching since 2004. Over the years, this was probably the most successful project I’ve seen come through my classroom. By “successful”, I’m talking the proportion of students who were able to walk outside of their comfort zone and into a challenging set of data, perform in-depth analyses, then communicate clear conclusions was much higher than in all previous years.

At the end of the year, after the AP Exam, after grades were all but inked on paper, students still talked excitedly about the project. I’d like to think it was the way I linked a fun activity to real-world analysis, though it most likely has to do with getting out of school for a few hours. Either way, they learned something valuable.
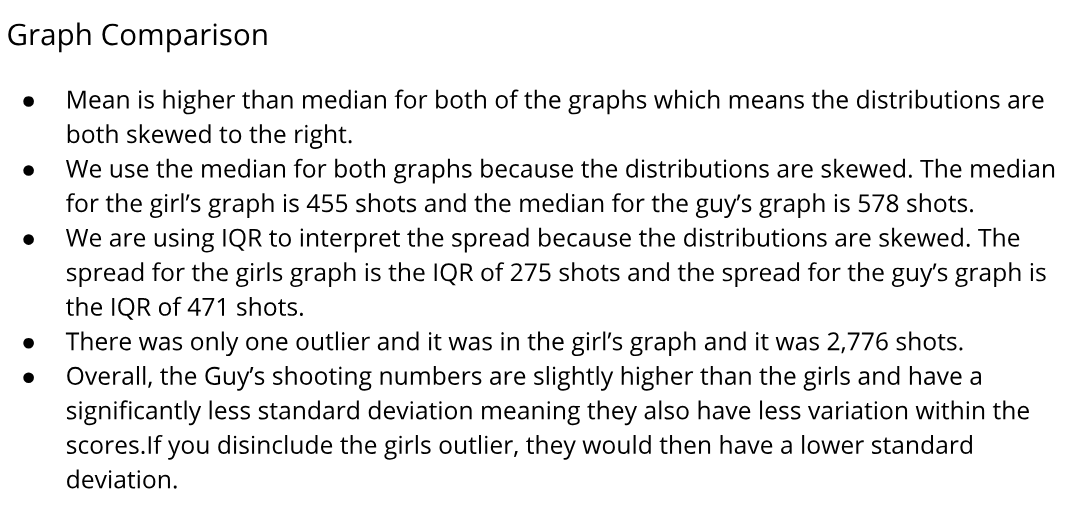
Univariate Analysis

One student, Abby, gave me permission to share her work adding, “This is the project that tied it all together. This was the moment I ‘got’ statistics.”

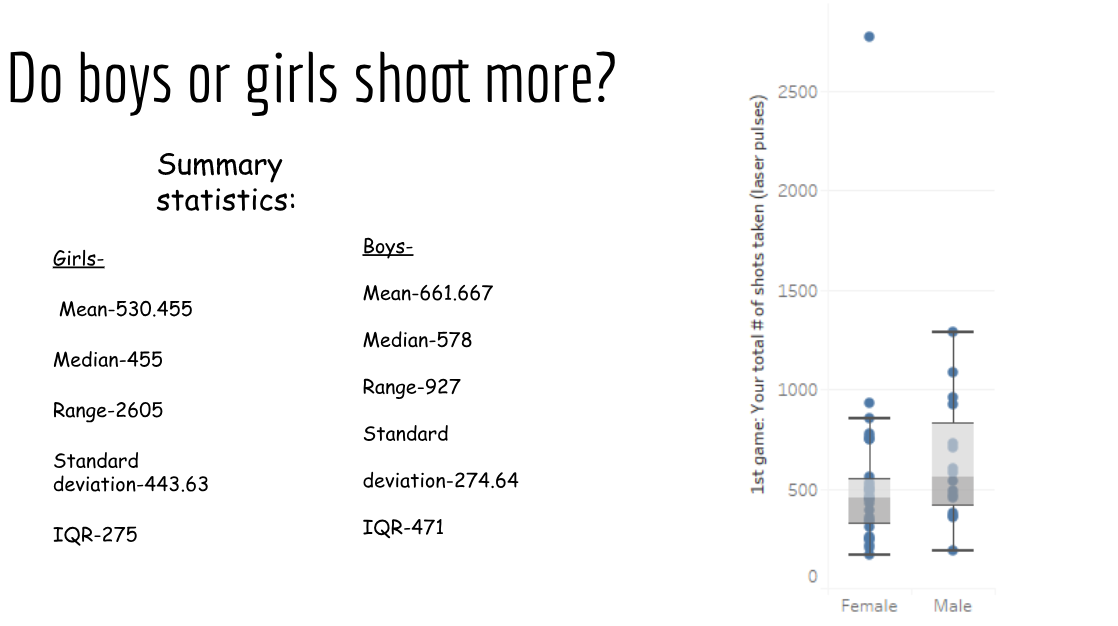
Interestingly, students were less inclined to suggest the female outlier of 2776 shots was a clerical mistake (which it was). I found there were two camps: Students who didn’t want to hurt feelings, and students who think outliers in the wild need no investigation. Hmmm.
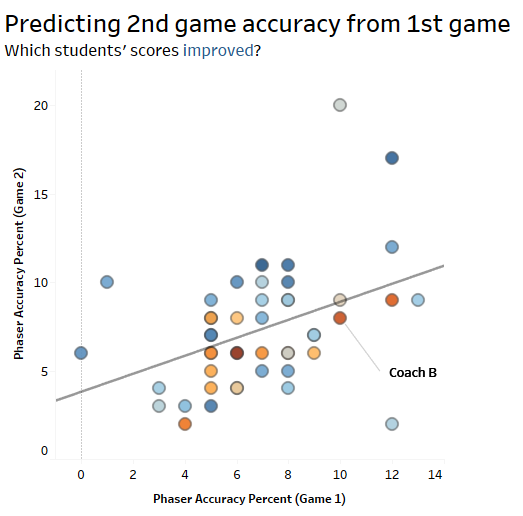
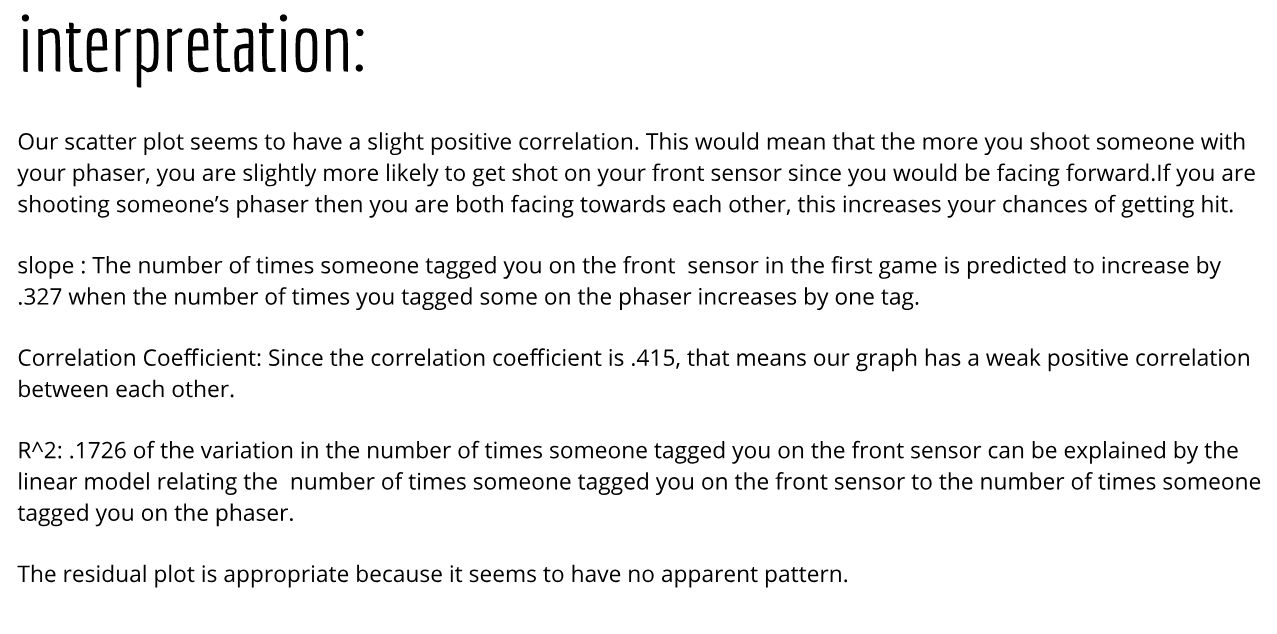
Bivariate Analysis

For a group of kids new to communicating stats, I thought this was pretty good. We tweaked their wording (to be more contextual) as we dove into more advanced stats, but their analysis was well thought through.

What I Learned

When you teach, you learn.
Earlier I said the project was a success based on the students’ results. That’s only partially true; it was also a success because I grew as an educator. After years of playing by the rules I realized that sometimes you need to get outside your comfort zone. For me that was two-fold: 1) Sucking it up and planning a field trip and 2) Losing the old, tired TI-83 practice problems and teaching real-world analytics tools.

How to Maximize Your Jellybeans

Milestone birthday this week.

As you’d imagine, I’ve been introspective. Am I living my best life? If I go out tomorrow, will I have regrets?

Regrets.

If you’ve asked my advice, I’ve recommended the adventure over the status-quo; the challenge over the straight path; the Soup Number 5 over the chicken fingers.  I’ve told you challenges grow you and discomfort makes you stronger. I come from personal experience — I’ve found regrets only inside the comfortable and the “supposed tos”.

My good friend Ericka lost her brother Daniel 5 years ago yesterday in a base-jumping accident. To honor his memory, Ericka posted a video he’d “have others watch for inspiration.”

So watch the video. And afterwards, if you want, you can keep reading this short post. But I won’t be offended if you choose to act on the emotions of the question, “What if you just had one more day? What are you going to do today?”

The day I had regrets.

Thursday, December 3rd 2015 started off with a strange, uncomfortable internal pain – which I chose to ignore. I was married to my schedule and my routine. So I went to the gym, got ready for work, dropped the kids off at their schools, and was at my school by 7:50am. A little voice told me, “Go to the hospital” as I walked into my classroom, but my duty was to my students, to my school, and to my responsibility to everyone else. “I’m sure it’s nothing,” I told my brain.

The pains would come and go every 5 minutes by that time. I taught (or, I tried to teach) my first period pre-calculus class. (I’ll never forget – it was a lesson on the Law of Sines ambiguous case. The “ASS” case. A tricky lesson involving logic, geometry, and effective cursing.) But I hit a point where the pain was so intense I’d have to stop the lesson and sit to take deep breaths. A student suggested I had appendicitis. And I remembered from natural childbirth the indication of real pain was the inability to walk or talk when it hit – and THIS is when I decided to step off that path of expectations of others and ask for help.

A coworker drove me to the hospital and a short while later, I was lying on a stretcher receiving an ultrasound on my abdomen. Stunned techs ran around me loudly relaying their confusion to each other. I’d had enough pain medicine to take the edge off the intensity, but at this point my stomach was beginning to protrude near my belly button and I understood the voices around me were screaming, “Emergency!”

When you think you are on your death bed, or when you’re given terrible news, or when you are in your last moments, I think the thoughts are the same: Have I said and done enough? Do the people I love know how I feel about them? Will my children remember me?

No regrets.

At 40 my regrets are now the words I didn’t say to the people I love.

But few are given a second chance to change how they live their life.

For the record, I had an intussusception – my small intestine telescoped into my large intestine and was sucked further and further until emergency surgery saved my life. It took a while for the doctors to solve my mystery because an intussusception is so rare in adults, especially in females. I was told at first it was most likely caused by colon cancer, though thankfully, the pathology report came back clear a few days later. After a full 6 days in the hospital and 26 staples down my abdomen, I was released into the arms of my loving family.

What if you just had one more day? What are you going to do today?

Rest in peace, Daniel Moore.

For what it’s worth … it’s never too late, or in my case too early, to be whoever you want to be. There’s no time limit. Start whenever you want. You can change or stay the same. There are no rules to this thing. We can make the best or the worst of it. I hope you make the best of it. I hope you see things that startle you. I hope you feel things you never felt before. I hope you meet people who have a different point of view. I hope you live a life you’re proud of, and if you’re not, I hope you have the courage to start all over again.

– F. Scott Fitzgerald, The Curious Case of Benjamin Button

5 Things Teaching Taught Me


5 years of letters from students

159 days ago, I turned in my classroom keys, signed away by school ID badge, and left teaching.

159 days of growth and change. And though I won’t get into the “why” details here, I must emphasize my reasons for leaving the classroom after 14 years had nothing to do with the students or the teaching.

Today, I took some time to go through a pile of letters from my kids over the most recent 5 years and reflect on what these beautiful minds taught me.


1) Everyone has a back story. Be kind.

I’m starting with the hardest one first — but hear me out.

It’s easy to dislike people. People suck. Especially in groups. (But keep in mind, you probably have sucked once or twice in your life to someone else, too.) And it’s even easier to find contempt for people you don’t know.

IMG_20180524_190959620But EVERYONE has a story.

I’ve met kids from all walks of life. Some had already been incarcerated when I met them. Others are in prison now. I’ve been threatened within the inch of my life. I’ve been cursed at, spit at, and ignored. As I grew as a teacher I found my only play is respond with kindness and compassion.

Why?

Because everyone has a story. And when kids are angry or hurting, they respond in the way you’d expect them to respond – teeth clenched, ready to take you on. I can’t teach you the multiplicative inverse of π/4 if you’ve got something significant weighing on your mind. (I’ll get into specific stories in a bit.)

Teachers spend a considerable amount of time developing relationships, the actual “teaching” plays a minor role. You learn to love on the kids like they are your own, you give them a safe place, and you think about them when they’re out of your sight.

True story: I once let a girl shove me into a set of lockers to give my student enough time to run away from a fight.

I’ve only spent 159 days around adults so far this year so I am no expert in that field; however, I’ve found they respond surprisingly well to a smile. At times I’ve noticed kindness is not what folks expect, and it disarms their defensiveness. (Note: Manipulative people know this too, which makes it hard for the most cynical of cynics to trust kindness. But be kind anyway.)

img_20181030_181926848

2) Listen.

If the first thing I learned is everyone has a story, then the second thing I discovered is to listen to those stories – some unfold like an epic narrative, while others are short and comical.

But every individual has a unique perspective, a different life experience from you. They may have just walked down a road you don’t realize you’ll be on next week. Maybe they DO know something you don’t?

Over the past 159 days, I’ve met so many beautiful people and listened to their stories. Instead of relearning the business world by taking another business class, I met with friends and strangers, asking them questions about themselves and their day-to-day jobs.  Surprisingly, where I have ended up in my job has everything to do with the conversations I had along the way.

I learned how to listen from my students. Often they would come to me to externally process some high school situation. Other times, though, they needed a confidant. Every interaction has grown my knowledge in some positive way. Listening to students taught me how to deal with serious situations and how to connect someone else’s experiences to my own. Listening grew my empathy. And even negative interactions will develop your character if you allow yourself to grow from the challenge.


img_20181030_182026641

3) People want someone to believe in them.

I’ll never forget a particular student in my Geometry class from a couple years ago. He was behind in school, on probation, no parental support, and on the edge of getting expelled. I noticed he didn’t struggle in math, his struggle was with life. And deep down, this wasn’t the life he wanted. Following lesson #1, I gave him a little room to decompress when he’d had a rough day. I left him alone when he was angry (except, when no one was looking, I’d give him a nod). I praised his work, I let him challenge me, and when I eventually gained his trust, I challenged him back. During my planning period he took to stopping by room just to chat — he liked to drop some F-bombs just to see what I would do, other times he’d sit down and vent, but mostly just tell me how much he wanted to graduate.

He just wanted someone to listen.

I gave him more chances than most to make up tests so he could pass the class. I did. I totally broke the rules right there – and I don’t regret it. Because I believed in him. Again, it was his daily life, not his intelligence, keeping his grades low.

But one day, as I watched from the window, he left school, got on his motorcycle, and took off. The administrator there told me the student had just DROPPED OUT. “He’ll probably be dead in ten years,” the admin scoffed. (WTF.)

Fast forward a year and a half later: This student walked across the stage at graduation. He’d come back, made up all his classes, and graduated with his class on time. Luckily, I wasn’t the only person who’d believed in him and someone else led him through the finish line. I cried ugly tears on that graduation day, May 2018.

img_20181030_181856876

4. Relationships matter.

For those in the back: ABOVE ALL ELSE, it’s about the relationships

IMG_20180524_190813353

.

Ask any teacher worth their salt and they will echo my sentiment. This job is NOT about test scores – these kids are not data points. This job is not about winning sporting or academic events. Teaching is about forming bonds and making connections.

Over my 14-year tenure, I not only taught in a classroom, I also coached girls’ cross-country in my early years, then the academic bowl team. I spent the last 5 years I advising the senior class. 

One day, I may no longer have a job, a house, a Twitter following. I’m sure I’ll be fine. But if I am not surrounded by the people I love, I have failed those people. I refuse to allow myself to be measured by my job title or social standing. Instead I prefer to leave a legacy built on the relationships I’ve forged and inspired by the people who have influenced me.

img_20181030_181959253

5. Forgive yourself.

This one I’m still learning.

Nothing ever goes as planned in teaching. You’ve got to be flexible, stay on the ball. Whatever magic dance you dance the night before a high-stakes test never seems to yield the results the lawmakers/shareholders/naysayers want. And because the “squeaky wheel gets the grease,” those of us with the pedal to the metal are offered no encouragement from above. It’s disheartening to only hear negative from the adults in the room.

To top it off, I would leave work every day feeling guilty because I felt I hadn’t done enough for my students, and feeling even more guilt that I hadn’t yet picked my own children up from school.

But then the kids… The kids would walk in my classroom, tell me their stories of the day. If I had been absent, they asked where I’d been. They’d write me letters year in and year out. The kids. The kids encourage ME. The kids teach me I should go easy on myself.

159 days away from the classroom. As I said, this one I’m still learning. I’m only human.

img_20181030_181725216img_20181030_181937060

Statistics is So Hot Right Now

so hot right now
so hot right now

Here is an article from the NY Times entitled “For Today’s Graduate, Just One Word: Statistics” (dated August 5, 1009) highlighting the ever-growing field of statistics.  Organizations such as Google and IBM are looking for good statisticians as the demand for data analysis increases:

“We’re rapidly entering a world where everything can be monitored and measured,” said Erik Brynjolfsson, an economist and director of the Massachusetts Institute of Technology’s Center for Digital Business. “But the big problem is going to be the ability of humans to use, analyze and make sense of the data.”

Another interesting quote in the article: “I keep saying that the sexy job in the next 10 years will be statisticians,” said Hal Varian, chief economist at Google. “And I’m not kidding.”

So you see, you can be nerdy AND cool.

Math in the Real World (or, I Know What I Did This Summer)

After almost two weeks in New Orleans this summer, I now excitedly carry in my pockets evidentiary examples, responses… just waiting for the the first person to ask that ubiquitous question all math teachers hear:  “When will I ever use this?”

I spent this time in the Crescent City working with several Not-for-Profit groups who partner with The Conservation Corps of Greater New Orleans.  The overarching goal of this umbrella organization is to teach and enable 16 – 24 year-olds who have either dropped out of school, spent time in the court system, or just want a new start with “environmentally restorative service projects” that ultimately lead to gainful employment in areas of societal need.

In the words of CCGNO:

“CCGNO programs take a service-learning approach to workforce development and community restoration. Our Corpsmembers play a central role in designing, proposing and implementing community service projects while learning skills that prepare them for careers in the emerging green economy. While promoting environmentally restorative practices, CCGNO programs seek to engage those young adults that have historically been disconnected from college and career opportunities.”**

So what did I do?  In a nutshell, I assisted Education Programs Coordinator Joey Kuchler and several program leaders in developing specific math curricula germane to their project needs.  For example, some of the Corpsmembers* will be learning construction so basic math skills are key.  (Fractions?  Yes, in construction you work with ruler readings to an eighth of an inch).  Other topics such as customary conversions, proportions and percents are just the beginning — remember triangles?  The Pythagorean Theorem and special right triangle calculations are often applied but trig ratios are especially necessary in construction math.

One morning, I accompanied Crew Leader Amber Parker of the Alliance for Affordable Energy to observe the weatherization process of an older New Orleans home.  Corpsmembers were not present but I had an inside look at the typical skills required to assess the needs of homeowners in the way of energy efficiency, and the math involved.  All windows and doors must be precisely measured (there’s your eighth-of-an-inch again) and after that, can you calculate what percent of each wall is window?  I do not have the background to detail what goes into this process next (it involves rating appliances, a tarp over the door with some blowing device, and something about negative/positive ions) but final calculations are made using software and ultimate energy needs are assessed, along with estimates of repairs and energy savings. 

[Side note: Those of you reading this who say, “Well who doesn’t know how to calculate percentages and use fractions?” should be thanking your math teachers right now.  Go ahead…I’ll wait….  Several Crew Leaders told me they were shocked as to how few Corpsmembers possessed even basic math skills.  Even those with GEDs and high school diplomas had almost no math skills, they said.  As a math teacher in Roswell, Georgia I can tell you with confidence that this lack of basic math skills is not confined to the educational system of Louisiana (elitists!) — I see these deficiencies every day!  Even with AP students!  Students fear the fractions, the word problems and the decimals so much that they avoid them (again, EVEN AP students) to the point they are innumerate.  But I digress.]   

My hope is to stay in touch with these dynamic leaders and follow the growth of the newest Corpsmembers in the programs.  Not only do I feel useful in this endeavor, I am, as I said, able to start the year fresh with better answers to students’ questions, even if they won’t believe me or listen.

 *Corpsmembers are the 16 – 24 year-olds participating in these programs.

**The Conservation Corps of Greater New Orleans recently received accolades in The New York Times in the article “New Orleans Program Links Green Jobs, Youth Development”

Social Norms for the Technophisticated

We all know I have a lot to say but class time is limited.  This year I will use this forum to enrich classroom discussion by sharing meaningful research and other fantastical and mathematical issues.  And sometimes I will venture to share general tidbits from the “real” world, the world you will soon inhabit.

Today’s nugget was brought to my attention in a blog entry by Peter Klein, a friend and Economics professor at the University of Missouri.  The article entitled “How to Behave: New Rules for Highly Evolved Humans” * from Wired Magazine suggests social norms for today’s technophisticated individual including:

  • Don’t Google-stalk before a first date
  • Wait before revealing TV spoilers
  • If your call drops, call back
  • Delete unwanted posts from your Facebook wallspoilers
  • Meet online friends in the real world
  • Don’t lie with your Facebook photo
  • Balance your media diet
  • Be mindful of your personal space

This said, texting in class is NOT okay.  Even if you are responding to your mom.  Save the social-networking for Social Studies class.

*Some content contained in this article may be construed as offensive and PG-13 in nature.  By clicking on this link you imply your willingness to navigate away from the original innocuous article written by Ms. Lloyd and agree to hold Ms. Lloyd harmless for any and all aftershocks.

What the Exam Graders say

Observations of the Chief Reader

The following information about the free-response section was provided by Roxy Peck, the Chief Reader for AP Statistics, after the 2001 AP Reading.

Exam performance this year (and in past years) was strongest in the area of describing data and weakest in the area of statistical inference. This was apparent in both the free-response inference questions as well as in the multiple-choice questions dealing with inference. In general, students were much stronger on the mechanical and computational aspects of problems than on parts that required interpretation or conceptual understanding. Communication of results continues to be a weakness.

Areas that continue to be problematic are listed below.

  • Many students failed to read questions carefully and, as a result answered a question different from the one that was asked.
  • Many students did not answer questions in context. Explanations and conclusions in context are always required for a complete answer.
  • More students than in past years stated assumptions when carrying out a hypothesis test, but few understood that assumptions must also be checked.
  • A large number of students seem to believe that it is okay to draw conclusions by “just looking at the data,” and did not seem to understand the need to employ inferential procedures even when asked to provide statistical evidence to support their conclusions.